
Key Takeaways
- The Dividend Contenders List includes U.S. companies that have increased dividends for 10 to 24 years, totaling 311 companies.
- These companies offer steady income growth and strong safety metrics, featuring an average dividend yield of 2.59%.
- Dividend Contenders have returned +16.6% over the past year, outperforming the S&P 500 Index.
- The list includes various sectors, with Financials having the most representation.
- Investing in Dividend Contenders can provide higher growth potential than older, mature stocks.
The Dividend Contenders List 2026 features high-quality U.S. companies that have increased their dividend payouts for 10 to 24 consecutive years. Originally tracked by the late David Fish, the Dividend Contenders represent businesses in their core compounding phase, offering a balance between reliable income growth, strong payout safety metrics, and capital appreciation potential.
Although this feat seems straightforward, the list is relatively small, with only 311 companies. This number is out of nearly 6,000 companies listed on the New York Stock Exchange (NYSE) and NASDAQ, indicating a success rate of approximately 5.18%.
Situated directly between Dividend Challengers (5–9 years of growth) and Dividend Champions or Aristocrats (25+ years of growth), the Contenders often deliver higher dividend growth rates than more mature stocks with less risk than earlier growth ones. Below is the updated dataset, sector breakdowns, valuation metrics, and downloadable resources for the 2026 Dividend Contenders.
Affiliate
Stock Rover is an award winning investment research platform.
- The site has 8,500+ stocks, 4,000 ETFs, and 40,000 mutual funds.
- Access to 650+ metrics, financial data, market news, stock and fund ratings, fair value, margin of safety, etc.
- Includes brokerage integration, portfolio tracking, rebalancing, watchlists, alerts, future income forecasts, etc.
Click here to try Stock Rover for free (14-day free trial).
Market Update for the Dividend Contenders 2026
The Dividend Contenders 2026 are currently trading at an elevated valuation of a trailing average price-to-earnings ratio of about 21.92X. This multiple is down from its peak of more than 27X in May 2021. The forward P/E ratio is a more reasonable16.59X.
The current average dividend yield is about 2.59%. The trailing average 10-year dividend growth rate is approximately 9.95%, and the average past 5-year dividend growth rate is around 8.53%. The average payout ratio is around 48.99%. The average market cap of the Dividend Contenders 2026 is currently $86,602 million.
Currently, the Dividend Contender with the highest yield is Community Healthcare (CHCT). The one trading with the lowest trailing earnings multiple is Allstate (ALL), while the one trading with the lowest forward earnings multiple is Comcast (CMCSA).
The updated, selected financial data and the dividend earnings calendar for each stock in the Dividend Champions list are in the tables below. The most recent dividend increases are also available.
In the trailing 1-year period, the Dividend Contenders 2026 returned +16.6% (blue line) compared to +15.0% for the S&P 500 Index (red line), as seen in the chart below. I used Stock Rover* for this chart. Sign up for more data and screeners. Over the trailing 5-years, the Dividend Contenders 2026 have returned +68.3%, and the S&P 500 Index has returned +79.1%.
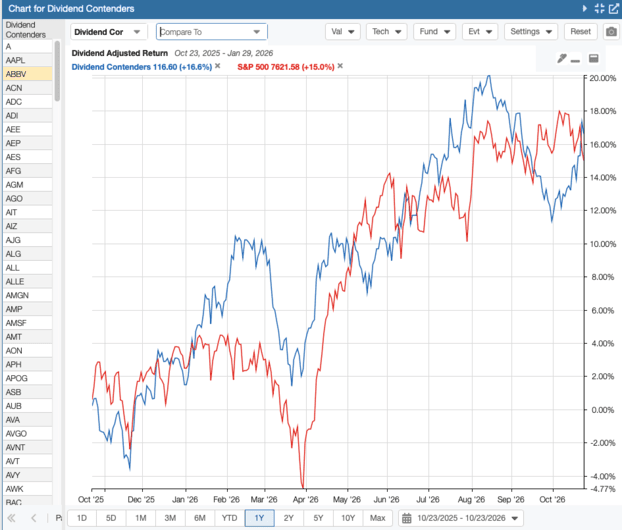
Source: Stock Rover*
Affiliate
Stock Rover is an award winning investment research platform.
- The site has 8,500+ stocks, 4,000 ETFs, and 40,000 mutual funds.
- Access to 650+ metrics, financial data, market news, stock and fund ratings, fair value, margin of safety, etc.
- Includes brokerage integration, portfolio tracking, rebalancing, watchlists, alerts, future income forecasts, etc.
- Plus export to spreadsheets, dividend calendar, 10+ years of data history, etc.
- Best Buy and Hold Screener by Investopedia
- Editor’s Choice by American Association of Individual Investors (AAII).
Click here to try Stock Rover for free (14-day free trial).
List of Dividend Contenders in 2026
Stock Rover* was used to create this table. Sign up to gain access to data, charts, and screeners.
| Ticker | Company Name | No. Years | Dividend Yield (%) | 10-yr Dividend Growth Rate (%) | Payout Ratio (%) | TTM P/E Ratio | Market Cap (millions) |
|---|---|---|---|---|---|---|---|
| A | Agilent Technologies | 13 | 0.6 | 8.3 | 19.9 | 35.1 | $50,104 |
| AAPL | Apple | 13 | 0.3 | 6.6 | 12 | 39.5 | $5,021,200 |
| ABBV | AbbVie | 12 | 2.4 | 11.7 | 190.4 | 80.4 | $503,133 |
| ACN | Accenture | 15 | 2.9 | 11.5 | 47.7 | 17.7 | $147,036 |
| ADC | Agree Realty | 13 | 5 | 5.3 | 162.8 | 34.7 | $8,023 |
| ADI | Analog Devices | 22 | 1.1 | 10.1 | 49.4 | 48.2 | $196,728 |
| AEE | Ameren | 12 | 2.8 | 5.8 | 51.1 | 18.7 | $29,475 |
| AEP | American Electric Power | 16 | 3 | 5.4 | 64.8 | 22.1 | $69,339 |
| AES | AES | 12 | 4.7 | 4.8 | 26.9 | 5.6 | $10,676 |
| AFG | American Financial Group | 20 | 2.6 | 12 | 30.1 | 13.1 | $12,419 |
| AGM | Federal Agricultural | 14 | 3.2 | 19.9 | 33.7 | 10.9 | $2,164 |
| AGO | Assured Guaranty | 14 | 2.2 | 11.3 | 19 | 9.2 | $3,042 |
| AIT | Applied Industrial Techs | 16 | 0.6 | 6.2 | 17.5 | 31 | $12,453 |
| AIZ | Assurant | 21 | 1.2 | 5.8 | 16.3 | 13.6 | $14,034 |
| AJG | Arthur J. Gallagher | 15 | 1.1 | 6.3 | 44.3 | 42.9 | $66,242 |
| ALG | Alamo Group | 11 | 0.9 | 14.2 | 15.3 | 17.8 | $1,806 |
| ALL | Allstate | 15 | 1.7 | 12.6 | 8.2 | 5 | $63,469 |
| ALLE | Allegion | 11 | 1.4 | 16.4 | 27.7 | 20.8 | $13,511 |
| AMGN | Amgen | 14 | 2.3 | 9.7 | 60.4 | 27.2 | $236,904 |
| AMP | Ameriprise Financial | 20 | 1.4 | 8.5 | 15.5 | 11.9 | $43,346 |
| AMSF | AMERISAFE | 12 | 6.4 | 8.6 | 64 | 10.3 | $472 |
| AMT | American Tower | 13 | 4 | 12.5 | 95.8 | 24.4 | $82,767 |
| AON | Aon | 14 | 1.1 | 9.5 | 16.8 | 16.2 | $62,432 |
| APH | Amphenol | 14 | 0.6 | 21.7 | 21.8 | 39.6 | $195,279 |
| APOG | Apogee Enterprises | 14 | 2.5 | 8 | 33.5 | 13.8 | $912 |
| ASB | Associated Banc | 14 | 3.3 | 8.1 | 33 | 10.2 | $5,510 |
| AUB | Atlantic Union Bankshares | 15 | 3.8 | 6.9 | 43.3 | 11.4 | $5,520 |
| AVA | Avista | 23 | 5.3 | 3.7 | 70.9 | 13.3 | $3,094 |
| AVGO | Broadcom | 15 | 0.8 | 29 | 31.5 | 43.1 | $1,611,576 |
| AVNT | Avient | 14 | 2.8 | 8.6 | 59.2 | 22 | $3,732 |
| AVT | Avnet | 12 | 1.6 | 8.1 | 34.4 | 23.2 | $7,658 |
| AVY | Avery Dennison | 15 | 2.2 | 9.3 | 41.7 | 19.6 | $13,571 |
| AWK | American Water Works Co | 17 | 2.7 | 9.1 | 58.5 | 23.4 | $26,788 |
| BAC | Bank of America | 12 | 2.5 | 15.6 | 27.2 | 12.1 | $355,230 |
| BAH | Booz Allen Hamilton | 13 | 3.2 | 14.7 | 35.7 | 11.8 | $9,023 |
| BBY | Best Buy Co | 21 | 4.1 | 13.1 | 63.1 | 15.7 | $19,741 |
| BC | Brunswick | 13 | 2.7 | 11.4 | n/a | n/a | $4,241 |
| BCPC | Balchem | 16 | 0.6 | 10.9 | 18.7 | 33.6 | $5,442 |
| BF.A | Brown-Forman | 17 | 3.2 | 5.4 | 59.3 | 18.6 | $13,228 |
| BFC | Bank First | 12 | 1.7 | 14.9 | 25.4 | 18.5 | $1,579 |
| BHB | Bar Harbor Bankshares | 22 | 3.4 | 6.4 | 43.8 | 13.1 | $647 |
| BIP | Brookfield Infr Partners | 17 | 5 | 5.7 | 285.5 | 58.8 | $16,766 |
| BLK | BlackRock | 15 | 2 | 9.6 | 50.3 | 26.2 | $177,959 |
| BMY | Bristol-Myers Squibb | 16 | 4.1 | 5.2 | 55.2 | 13.5 | $124,921 |
| BNY | Bank of New York Mellon | 18 | 1.5 | 12.7 | 24.3 | 16.2 | $98,959 |
| BOKF | BOK Financial | 20 | 2 | 3.9 | 22.9 | 11.5 | $7,685 |
| BR | Broadridge Financial | 18 | 2.4 | 12.7 | 40.3 | 18.6 | $20,135 |
| BWXT | BWX Technologies | 10 | 0.8 | 11.6 | 26.8 | 35 | $12,378 |
| CASS | Cass Information Systems | 21 | 2.3 | 6.7 | 44.9 | 19.8 | $702 |
| CBOE | Cboe Global Markets | 15 | 1.1 | 13.2 | 22.4 | 24.9 | $33,332 |
| CBT | Cabot | 14 | 2.5 | 4.6 | 50.9 | 20.7 | $3,811 |
| CCBG | Capital City Bank Group | 11 | 2.2 | 21 | 29.4 | 13.8 | $846 |
| CDW | CDW | 12 | 1.6 | 19.3 | 30.1 | 19 | $19,790 |
| CHCO | City Holding | 14 | 2.8 | 8.8 | 37.2 | 15.4 | $1,981 |
| CHCT | Community Healthcare | 10 | 14 | 1.5 | 288.6 | 19.1 | $360 |
| CHDN | Churchill Downs | 15 | 0.5 | 8.6 | 7.5 | 14.1 | $5,769 |
| CHE | Chemed | 17 | 0.6 | 10.4 | 12.1 | 25.7 | $6,686 |
| CIVB | Civista Bancshares | 13 | 2.7 | 11.6 | 25.9 | 9.9 | $554 |
| CMCSA | Comcast | 17 | 6 | 9.1 | 42.3 | 7.1 | $78,317 |
| CME | CME Group | 15 | 1.8 | 8 | 94.9 | 25.1 | $106,420 |
| CMI | Cummins | 20 | 1.6 | 7.9 | 40.7 | 27.7 | $74,621 |
| CMS | CMS Energy | 18 | 3.4 | 6.3 | 66.6 | 20.5 | $21,359 |
| CNO | CNO Finl Group | 13 | 1.3 | 8.4 | 23.2 | 19.2 | $5,124 |
| CNS | Cohen & Steers | 16 | 3.8 | 9.9 | 80.2 | 21.6 | $3,611 |
| COR | Cencora | 21 | 0.7 | 5.8 | 17.4 | 25.3 | $64,956 |
| COST | Costco Wholesale | 21 | 0.6 | 12.6 | 26.7 | 48.1 | $442,321 |
| CPK | Chesapeake Utilities | 22 | 2.3 | 9.2 | 44.4 | 20.7 | $3,279 |
| CSCO | Cisco Systems | 14 | 1.6 | 4.9 | 49.4 | 32.2 | $422,881 |
| CSX | CSX | 12 | 1.2 | 8.8 | 31.4 | 28.1 | $89,510 |
| CTRE | CareTrust REIT | 21 | 4.4 | 8.7 | 91.2 | 22.3 | $8,426 |
| CUBE | CubeSmart | 11 | 5.4 | 9.7 | 144.5 | 26.7 | $8,772 |
| DDS | Dillard's | 15 | 0.2 | 15.7 | 2.8 | 16.3 | $10,761 |
| DGICA | Donegal Group | 15 | 4.1 | 3.4 | 37.8 | 9.7 | $691 |
| DGX | Quest Diagnostics | 23 | 1.4 | 8 | 34.2 | 25.4 | $26,358 |
| DHI | D.R. Horton | 14 | 1.3 | 18.9 | 16.6 | 13.3 | $38,872 |
| DHR | Danaher | 11 | 0.7 | 12.3 | 25.5 | 41.7 | $164,512 |
| DKL | Delek Logistics Partners | 12 | 7.9 | 6.1 | 155.9 | 19.6 | $3,280 |
| DKS | Dick's Sporting Goods | 13 | 3.5 | 23.5 | 52.5 | 15.4 | $13,982 |
| DLB | Dolby Laboratories | 11 | 2.3 | 11.6 | 59.2 | 26.6 | $5,856 |
| DOX | Amdocs | 11 | 3.7 | 11.3 | 51.8 | 14.6 | $6,428 |
| DPZ | Domino's Pizza | 13 | 2.6 | 18 | 42.3 | 17.1 | $10,230 |
| DTE | DTE Energy | 12 | 3.6 | 4.2 | 72.3 | 20.6 | $26,979 |
| DUK | Duke Energy | 16 | 3.6 | 2.4 | 64 | 18.2 | $94,100 |
| EBMT | Eagle Bancorp Montana | 15 | 2.8 | 6.3 | 28.2 | 10.2 | $167 |
| EFSC | Enterprise Finl Servs | 15 | 2.2 | 12.3 | 25.6 | 12 | $2,179 |
| EIX | Edison International | 11 | 6.1 | 6.2 | 35.6 | 5.9 | $22,005 |
| ELS | Equity Lifestyle Props | 21 | 3.7 | 9.8 | 102.2 | 28.6 | $11,484 |
| ELV | Elevance Health | 21 | 1.6 | 10.2 | 30.3 | 19.2 | $94,150 |
| EMN | Eastman Chemical | 14 | 5.3 | 6.2 | 86.3 | 16.6 | $7,257 |
| ENSG | Ensign Group | 16 | 0.2 | 5 | 3.9 | 27.2 | $10,102 |
| EQIX | Equinix | 18 | 2.1 | 11.4 | 126.4 | 64 | $98,127 |
| ETN | Eaton Corp | 10 | 1.1 | 6.8 | 43.4 | 40.1 | $152,944 |
| ETR | Entergy | 16 | 2.4 | 4.2 | 63.5 | 27.1 | $50,680 |
| EVR | Evercore | 11 | 1.4 | 11.1 | 17.7 | 14.2 | $9,693 |
| EVRG | Evergy | 18 | 3.3 | 6.2 | 68.6 | 21.2 | $19,169 |
| EXPO | Exponent | 22 | 1.7 | 13.2 | 54.5 | 32.8 | $3,475 |
| FAF | First American Financial | 12 | 3.7 | 6 | 30.4 | 9.2 | $6,782 |
| FBIZ | First Business Finl Servs | 15 | 1.9 | 11 | 19.2 | 10.8 | $592 |
| FCBC | First Community | 13 | 2.6 | 7.5 | 39 | 15.3 | $913 |
| FDBC | Fidelity D & D Bancorp | 14 | 2.9 | 8.3 | 32 | 11.2 | $340 |
| FFIN | First Finl Bankshares | 11 | 3 | 9.3 | 40.4 | 14.7 | $4,266 |
| FITB | Fifth Third Bancorp | 15 | 3.2 | 12.4 | 54 | 17.7 | $47,901 |
| FIX | Comfort Systems USA | 15 | 0.3 | 29.1 | 6.4 | 34.5 | $49,293 |
| FMAO | Farmers & Merchants | 12 | 2.7 | 7.6 | 31.6 | 12.1 | $483 |
| FNF | Fidelity National Finl | 20 | 5.1 | 9.5 | 71.5 | 14.1 | $10,891 |
| FNLC | First Bancorp | 14 | 4.4 | 5.1 | 54.6 | 10.3 | $390 |
| FNV | Franco-Nevada | 12 | 0.7 | 7.2 | 21.4 | 31.8 | $46,960 |
| FR | First Industrial Realty | 16 | 3.4 | 10.2 | 69 | 21.6 | $7,872 |
| FRME | First Merchants | 12 | 3.7 | 10.2 | 46.3 | 12.9 | $2,510 |
| FSBW | FS Bancorp | 14 | 2.6 | 19.2 | 25.7 | 10.2 | $347 |
| GABC | German American Bancorp | 12 | 2.4 | 10 | 31.7 | 13.1 | $1,874 |
| GATX | GATX | 13 | 1.6 | 5.1 | 25.1 | 16.3 | $5,800 |
| GFF | Griffon | 15 | 0.9 | 16 | 20.9 | 20.4 | $4,285 |
| GL | Globe Life | 14 | 0.8 | 9 | 7.8 | 11.3 | $13,030 |
| GS | Goldman Sachs Group | 20 | 2.2 | 22.6 | 25.5 | 13 | $263,364 |
| GTY | Getty Realty | 14 | 7.1 | 6.9 | 117.4 | 16.7 | $1,702 |
| HBCP | Home Bancorp | 13 | 2.1 | 12.3 | 21.8 | 10.5 | $469 |
| HD | Home Depot | 11 | 3 | 12.9 | 64.7 | 22 | $313,353 |
| HEI | Heico | 16 | 0.1 | 12.2 | 4.1 | 49.7 | $41,672 |
| HFBL | Home Federal Bancorp Inc | 18 | 2.5 | 12.8 | 26.3 | 12 | $72 |
| HFWA | Heritage Financial | 12 | 3.6 | 7.6 | 45.1 | 13.2 | $1,132 |
| HIG | The Hartford Insurance Gr | 14 | 1.8 | 11.1 | 14.8 | 9.6 | $36,786 |
| HII | Huntington Ingalls Indus | 13 | 2 | 10.7 | 32.7 | 16.3 | $10,800 |
| HMN | Horace Mann Educators | 13 | 3.1 | 3.1 | 32.8 | 10.8 | $1,876 |
| HNI | HNI | 16 | 3.1 | 2.4 | n/a | n/a | $3,253 |
| HOMB | Home BancShares | 15 | 2.9 | 9.8 | 35.3 | 12 | $5,873 |
| HPQ | HP | 15 | 3.8 | 9.2 | 44.9 | 12 | $28,243 |
| HUBB | Hubbell | 15 | 1.2 | 8.5 | 32.9 | 27.3 | $24,345 |
| HVT | Haverty Furniture Cos | 18 | 4.6 | 10.6 | 92.3 | 20.8 | $444 |
| HWBK | Hawthorn Bancshares | 13 | 2.2 | 18.6 | 22.3 | 10.4 | $278 |
| HWKN | Hawkins | 10 | 0.6 | 6.9 | 19.5 | 33.8 | $2,719 |
| HY | Hyster Yale | 15 | 4.9 | 2.2 | n/a | n/a | $533 |
| IBCP | Independent Bank | 13 | 3.1 | 13.3 | 31 | 10.4 | $798 |
| IBOC | International Bancshares | 11 | 2.2 | 8.9 | 21.5 | 9.8 | $4,105 |
| ICE | Intercontinental Exchange | 16 | 1.3 | 11.8 | 28.1 | 22.2 | $88,531 |
| IDA | Idacorp | 12 | 2.5 | 5.6 | 56.7 | 23 | $8,017 |
| IEX | IDEX | 14 | 1.2 | 7.9 | 51.5 | 33.9 | $17,357 |
| INDB | Independent Bank | 16 | 3.2 | 8.2 | 37.2 | 12 | $3,850 |
| INGR | Ingredion | 15 | 3.5 | 5.2 | 35.3 | 10.4 | $6,033 |
| INTU | Intuit | 15 | 1.7 | 15 | 29 | 20.4 | $89,657 |
| IOSP | Innospec | 14 | 1.8 | 10.8 | 36.5 | 20.4 | $2,455 |
| ISTR | Investar Holding | 12 | 1.7 | 27 | 17.3 | 11.8 | $395 |
| ITT | ITT | 11 | 0.8 | 12 | 28.7 | 39.2 | $17,915 |
| JBHT | JB Hunt Transport Servs | 13 | 0.8 | 7.4 | 25 | 32.2 | $21,460 |
| JJSF | J&J Snack Foods | 21 | 3.9 | 7.4 | 123.6 | 31.7 | $1,526 |
| JPM | JPMorgan Chase | 21 | 2 | 13.1 | 25.8 | 14.1 | $889,970 |
| KAI | Kadant | 15 | 0.5 | 6.6 | 14.8 | 28.5 | $3,134 |
| KLAC | KLA | 12 | 0.6 | 16 | 21.7 | 44.6 | $213,172 |
| KR | Kroger | 16 | 2.4 | 12.5 | 75.3 | 35.6 | $37,865 |
| KWR | Quaker Houghton | 19 | 1.4 | 4.4 | 35.8 | 28 | $2,697 |
| LAD | Lithia Motors | 18 | 1 | 10.8 | 7.3 | 8.9 | $5,918 |
| LAND | Gladstone Land | 15 | 6.5 | 1.2 | n/a | n/a | $369 |
| LFUS | Littelfuse | 11 | 0.8 | 9.3 | n/a | n/a | $9,898 |
| LHX | L3Harris Technologies | 15 | 2 | 9 | 49.2 | 25 | $46,097 |
| LII | Lennox International | 24 | 1.5 | 12.2 | 23.7 | 16.2 | $12,664 |
| LKFN | Lakeland Financial | 16 | 3.6 | 10.8 | 46.7 | 13.3 | $1,441 |
| LLY | Eli Lilly | 14 | 0.5 | 13 | 21.7 | 42.7 | $1,133,984 |
| LMAT | LeMaitre Vascular | 11 | 1.2 | 18.7 | 31.1 | 29.3 | $1,912 |
| LMT | Lockheed Martin | 14 | 2.6 | 7.7 | 50.1 | 20.4 | $127,389 |
| LNN | Lindsay | 23 | 1.4 | 2.7 | 28.2 | 20.4 | $1,082 |
| LNT | Alliant Energy | 23 | 3.1 | 6.2 | 65.8 | 21.7 | $17,734 |
| LOGI | Logitech International | 22 | 1.5 | 9.4 | 26.9 | 20.3 | $15,805 |
| LRCX | Lam Research | 12 | 0.5 | 27.1 | 18 | 45.3 | $326,383 |
| LSTR | Landstar System | 11 | 1 | 17.2 | 41.5 | 44.4 | $5,813 |
| LYB | LyondellBasell Industries | 11 | 4.4 | -2.1 | n/a | n/a | $20,441 |
| MA | Mastercard | 12 | 0.6 | 16.4 | 17.9 | 34.2 | $545,311 |
| MAA | Mid-America Apartment | 14 | 5.2 | 6.4 | 178.1 | 34.4 | $13,657 |
| MAIN | Main Street Capital | 15 | 6 | 1.5 | 86.1 | 10.7 | $4,985 |
| MAS | Masco | 18 | 1.7 | 12.9 | 29 | 17.2 | $14,699 |
| MATX | Matson | 12 | 0.7 | 7.2 | 9.5 | 15.8 | $7,015 |
| MBWM | Mercantile Bank | 12 | 2.7 | 8.9 | 27.8 | 10.4 | $1,013 |
| MCHP | Microchip Technology | 14 | 2.4 | 9.7 | 271.6 | n/a | $41,882 |
| MCK | McKesson | 23 | 0.4 | 12.9 | 8.7 | 27.2 | $118,407 |
| MCO | Moodys | 18 | 0.9 | 10.8 | 24.9 | 30.5 | $83,306 |
| MDLZ | Mondelez International | 16 | 3.3 | 10.6 | 73.3 | 23.1 | $80,081 |
| MET | MetLife | 12 | 2.3 | 4 | 43.6 | 19.6 | $64,938 |
| MGA | Magna International | 13 | 3.1 | 7.1 | 71.3 | 23.5 | $17,072 |
| MKTX | MarketAxess Holdings | 10 | 1.9 | 11.6 | 36.2 | 19.4 | $5,781 |
| MORN | Morningstar | 16 | 0.9 | 8.6 | 18.4 | 20.3 | $8,015 |
| MPLX | MPLX | 14 | 7.4 | 7.8 | 90 | 12.6 | $59,259 |
| MRK | Merck & Co | 12 | 2.3 | 6.3 | 264.6 | 119 | $369,803 |
| MRSH | Marsh | 15 | 2.1 | 11.3 | 43.9 | 22.8 | $90,936 |
| MS | Morgan Stanley | 16 | 2.5 | 19.1 | 32.6 | 14.8 | $293,868 |
| MSCI | MSCI | 12 | 1.4 | 22 | 42 | 32 | $43,961 |
| MSEX | Middlesex Water | 11 | 2.7 | 6.1 | 54.8 | 20.7 | $1,010 |
| MSFT | Microsoft | 22 | 0.7 | 9.7 | 19.8 | 29.7 | $3,956,404 |
| MSI | Motorola Solutions | 21 | 1 | 11.4 | 36.8 | 36.8 | $77,362 |
| MTRN | Materion | 14 | 0.2 | 4.3 | 13 | 58.2 | $5,204 |
| MWA | Mueller Water Products | 13 | 1.3 | 8.8 | 19.4 | 15.4 | $3,412 |
| NBTB | NBT Bancorp | 11 | 3.1 | 5.7 | 36.1 | 12.6 | $2,673 |
| NDAQ | Nasdaq | 13 | 1.2 | 11.3 | 32.4 | 28 | $53,762 |
| NHC | National Healthcare | 13 | 1.1 | 4.1 | 28.7 | 26.4 | $3,674 |
| NKE | Nike | 21 | 4.4 | 9.9 | 78.5 | 18 | $55,743 |
| NNI | Nelnet | 24 | 1.1 | 10.6 | 15.4 | 15 | $4,492 |
| NOC | Northrop Grumman | 11 | 1.8 | 10.6 | 30.1 | 17 | $76,612 |
| NRIM | Northrim BanCorp | 22 | 2.8 | 13 | 25.9 | 9.6 | $526 |
| NSP | Insperity | 16 | 4.8 | 17 | n/a | n/a | $1,913 |
| NWE | NorthWestern Energy Group | 15 | 3.5 | 3 | 95.3 | 27.5 | $4,682 |
| NXST | Nexstar Media Gr | 20 | 4.5 | 22.7 | 138 | 31.2 | $5,075 |
| OC | Owens-Corning | 12 | 2.8 | 15.9 | n/a | n/a | $8,870 |
| ODC | Oil-Dri Corp of America | 11 | 1.2 | 7.4 | 23.5 | 18.9 | $1,069 |
| OGE | OGE Energy | 12 | 3.6 | 3.5 | 73.9 | 21.1 | $9,906 |
| OGS | ONE Gas | 19 | 3.6 | 6.9 | 57.9 | 16.3 | $4,747 |
| ORCL | Oracle | 11 | 1.6 | 12.8 | 30.9 | 20.2 | $391,336 |
| OSK | Oshkosh | 11 | 1.7 | 11.6 | 24.6 | 15.5 | $8,368 |
| OTEX | Open Text | 12 | 4.2 | 9.3 | 42.6 | 10.4 | $6,476 |
| OTTR | Otter Tail | 12 | 2.5 | 6.3 | 47.3 | 19.4 | $3,769 |
| OVLY | Oak Valley | 12 | 2.3 | 12.1 | 23.8 | 11.7 | $277 |
| PAYX | Paychex | 11 | 4.2 | 10 | 89.9 | 22.3 | $40,068 |
| PB | Prosperity Bancshares | 12 | 3.5 | 7.2 | 41.2 | 11.8 | $8,186 |
| PEBO | Peoples Bancorp | 22 | 4.5 | 10.1 | 49.4 | 11.3 | $1,341 |
| PEG | Public Service Enterprise | 10 | 3.8 | 5 | 64.5 | 17.7 | $35,387 |
| PFE | Pfizer | 14 | 5.8 | 3.7 | 226.3 | 39.3 | $170,192 |
| PFG | Principal Financial Group | 15 | 3.1 | 7.4 | 44.8 | 15.5 | $23,215 |
| PLD | Prologis | 17 | 3.4 | 9.8 | 92.5 | 28.4 | $121,280 |
| PM | Philip Morris Intl | 12 | 3.2 | 4.4 | 84.5 | 28.4 | $307,778 |
| PNC | PNC Financial Services Gr | 17 | 3.6 | 13.8 | 37.8 | 11.9 | $88,919 |
| PNW | Pinnacle West Capital | 15 | 3.5 | 3.8 | 68.1 | 20 | $12,594 |
| POOL | Pool | 14 | 3 | 15.4 | 46.4 | 15.8 | $6,268 |
| POR | Portland General Electric | 15 | 5 | 5.6 | 94.1 | 19.4 | $5,165 |
| POWI | Power Integrations | 19 | 1.8 | 12.7 | 184.8 | 109.7 | $2,695 |
| PRGO | Perrigo | 13 | 7.3 | 7.2 | n/a | n/a | $2,206 |
| PRI | Primerica | 22 | 1.7 | 20.9 | 18 | 11.4 | $8,762 |
| PRU | Prudential Financial | 15 | 4.9 | 7.2 | 49.6 | 10.4 | $39,609 |
| PSX | Phillips 66 | 17 | 1.8 | 7.3 | 28.1 | 16.6 | $115,763 |
| QCOM | Qualcomm | 13 | 2.1 | 5.7 | 41.1 | 20.6 | $189,893 |
| QSR | Restaurant Brands Intl | 22 | 3.5 | 15 | 68.1 | 18.6 | $25,868 |
| R | Ryder System | 10 | 1.7 | 8.7 | 29.2 | 19.5 | $9,218 |
| RBA | RB Global | 21 | 1.6 | 6.9 | 53 | 35.4 | $15,187 |
| REXR | Rexford Industrial Realty | 21 | 4.7 | 12.4 | n/a | n/a | $8,203 |
| RF | Regions Financial | 12 | 3.9 | 16.5 | 42.7 | 11.5 | $23,896 |
| RGA | Reinsurance Group | 13 | 1.5 | 9.1 | 16.2 | 11.9 | $17,586 |
| RGCO | RGC Resources | 16 | 3.9 | 4.9 | 63 | 16.3 | $229 |
| RGLD | Royal Gold | 22 | 0.8 | 7.5 | 20.4 | 26.8 | $20,512 |
| RHI | Robert Half | 24 | 6.8 | 10.4 | 205.2 | 30.1 | $3,544 |
| RJF | Raymond James Finl | 21 | 1.4 | 15 | 18.1 | 13.6 | $29,949 |
| RMD | ResMed | 16 | 1.1 | 7.2 | 22.9 | 23.6 | $34,625 |
| ROK | Rockwell Automation | 13 | 1.3 | 6.6 | 50.8 | 41.1 | $48,695 |
| RS | Reliance | 16 | 1.2 | 11.4 | 28.3 | 24.5 | $21,536 |
| RSG | Republic Services | 15 | 1.2 | 7.7 | 35.4 | 32.7 | $70,520 |
| SBFG | SB Financial Group | 22 | 2.1 | 10.8 | 23.1 | 11.2 | $186 |
| SBUX | Starbucks | 12 | 2.5 | 12 | 142.8 | 57.3 | $112,950 |
| SCI | Service Corp Intl | 15 | 1.8 | 10.7 | 35.1 | 21.3 | $11,061 |
| SFBS | Servisfirst Bancshares | 15 | 1.9 | 25.2 | 24.3 | 12.7 | $4,350 |
| SFNC | Simmons First Ntl | 13 | 3.8 | 6 | 47.6 | 11.9 | $3,305 |
| SGU | Star Group | 11 | 6.1 | 6.8 | 33.2 | 5.7 | $423 |
| SHOE | Shoe Station Group | 14 | 5.1 | 17.1 | 71.9 | 15 | $359 |
| SIGI | Selective Insurance Gr | 13 | 1.9 | 11.1 | 20.6 | 11.3 | $5,427 |
| SMBC | Southern Missouri Bancorp | 12 | 1.5 | 10.4 | 15.5 | 11 | $775 |
| SNA | Snap-on | 14 | 2.6 | 14.9 | 47.5 | 18.8 | $19,095 |
| SO | Southern | 16 | 3.4 | 3.1 | 68.7 | 21.8 | $103,969 |
| SR | Spire | 24 | 4 | 5.3 | 36.3 | 23.9 | $4,878 |
| SRE | Sempra | 22 | 3.2 | 5.7 | 75.3 | 24.1 | $54,603 |
| SSB | SouthState Bank | 15 | 2.6 | 7.8 | 25.1 | 10.8 | $9,955 |
| SSD | Simpson Manufacturing Co | 14 | 0.7 | 5.2 | 12.7 | 19.7 | $7,379 |
| STAG | Stag Industrial | 12 | 4.3 | 12.8 | 116.9 | 28.1 | $7,028 |
| STBA | S&T Bancorp | 14 | 3 | 6.9 | 37.8 | 13 | $1,721 |
| STE | Steris | 13 | 1.2 | 9.4 | 30.7 | 27.1 | $21,596 |
| STLD | Steel Dynamics | 15 | 0.9 | 14.2 | 15.4 | 18.3 | $35,538 |
| STT | State Street | 13 | 2.2 | 9.2 | 27.6 | 13.8 | $46,407 |
| STZ | Constellation Brands | 15 | 3.1 | 9.9 | 36.7 | 11.8 | $22,341 |
| SXI | Standex International | 11 | 0.5 | 9.3 | 15.4 | 31.1 | $3,311 |
| SYBT | Stock Yards Bancorp | 15 | 1.7 | 6.2 | 25.4 | 15.3 | $2,379 |
| TCBK | TriCo Bancshares | 16 | 2.7 | 9.1 | 34.3 | 12.7 | $1,687 |
| TEL | TE Connectivity | 13 | 1.5 | 7.7 | 28.3 | 21 | $61,968 |
| THG | The Hanover Insurance Gr | 15 | 1.6 | 7.5 | 17.6 | 11.1 | $8,079 |
| THO | Thor Industries | 19 | 3.1 | 5.7 | 61.4 | 19.7 | $3,427 |
| TKR | Timken | 15 | 1.3 | 3.3 | 37.9 | 31.2 | $7,968 |
| TOWN | Towne Bank | 12 | 3.1 | 8 | 54 | 18 | $3,270 |
| TRN | Trinity Indus | 14 | 4.9 | 10.9 | 28.6 | 5.9 | $2,008 |
| TRNO | Terreno Realty | 15 | 3.5 | 11 | 55.6 | 17.6 | $7,144 |
| TRV | Travelers Companies | 14 | 1.3 | 6.4 | 12.1 | 10.5 | $83,198 |
| TSBK | Timberland Bancorp | 20 | 2.6 | 12.8 | 27.9 | 11.4 | $353 |
| TSCO | Tractor Supply | 12 | 2.9 | 17.5 | 49 | 17 | $17,001 |
| TSN | Tyson Foods | 15 | 3.7 | 13 | 121.6 | 34.5 | $19,657 |
| TTC | Toro | 14 | 1.5 | 10 | 41.3 | 27.6 | $9,786 |
| TTEK | Tetra Tech | 22 | 0.8 | 14.9 | 15.9 | 21.1 | $8,973 |
| TXN | Texas Instruments | 11 | 2.1 | 14.1 | 85 | 43.9 | $263,197 |
| TXNM | TXNM Energy | 20 | 2.9 | 6.7 | 94.3 | 33.6 | $6,442 |
| UBCP | United Bancorp | 14 | 5.8 | 6 | 55.4 | 9.8 | $77 |
| UCB | United Community Banks | 12 | 2.9 | 12.5 | 32.6 | 11.7 | $4,320 |
| UDR | UDR | 11 | 5 | -6.9 | 109.2 | 22.2 | $11,249 |
| UFPI | UFP Industries | 16 | 1.8 | 17.4 | 32.5 | 18.3 | $4,411 |
| UNH | UnitedHealth Group | 13 | 2.2 | 14 | 57.5 | 26.8 | $374,260 |
| UNM | Unum Gr | 16 | 2.2 | 9.7 | 42.9 | 21.9 | $14,837 |
| UNP | Union Pacific | 17 | 2 | 9.9 | 44.6 | 23.3 | $171,028 |
| UNTY | Unity Bancorp | 19 | 1.2 | 14.1 | 10.4 | 9.4 | $570 |
| UPS | United Parcel Service | 12 | 6.6 | 7.7 | 121.7 | 18.5 | $84,717 |
| USB | U.S. Bancorp | 16 | 3.7 | 6.8 | 40.9 | 11.5 | $92,026 |
| UTL | Unitil | 15 | 3.6 | 3 | 58.4 | 16.9 | $976 |
| UTMD | Utah Medical Products | 11 | 1.7 | 1.8 | 37.7 | 22.8 | $237 |
| V | Visa | 21 | 0.7 | 16.9 | 22.1 | 34.7 | $765,998 |
| VALU | Value Line | 17 | 3.4 | 7.5 | 64 | 19.6 | $387 |
| VMC | Vulcan Materials | 11 | 0.8 | 10 | 23.7 | 31.2 | $34,292 |
| VZ | Verizon Communications | 12 | 6.5 | 2.1 | 72.8 | 11.4 | $181,043 |
| WAFD | WaFd | 21 | 3.8 | 6.8 | 33.6 | 8.8 | $2,097 |
| WCN | Waste Connections | 16 | 0.8 | 13.7 | 32.9 | 40.7 | $42,390 |
| WDFC | WD-40 | 10 | 2.1 | 9.3 | 59.4 | 29.3 | $2,583 |
| WEC | WEC Energy Group | 16 | 3.5 | 6.8 | 71 | 21.1 | $35,351 |
| WLK | Westlake | 22 | 3.5 | 10.8 | n/a | n/a | $7,771 |
| WM | Waste Management | 21 | 1.7 | 8.7 | 49.9 | 32.5 | $91,773 |
| WMS | Advanced Drainage Systems | 22 | 0.6 | 12.8 | 12.7 | 22.1 | $9,801 |
| WRB | WR Berkley | 11 | 0.5 | 10 | 8 | 15.7 | $27,589 |
| WSBC | Wesbanco | 20 | 4 | 4.7 | 43.8 | 10.9 | $3,611 |
| WSM | Williams-Sonoma | 15 | 1.2 | 15.2 | 28.7 | 26 | $29,855 |
| WSO | Watsco | 19 | 4.3 | 12.1 | 105.3 | 26.1 | $12,582 |
| WTS | Watts Water Technologies | 12 | 0.6 | 13.3 | 19.1 | 31.7 | $12,128 |
| XEL | Xcel Energy | 13 | 3.1 | 5.7 | 63.5 | 21 | $47,949 |
| XYL | Xylem | 22 | 1.6 | 10.7 | 39.5 | 25.3 | $24,823 |
| ZION | Zions Bancorp | 14 | 2.9 | 19.6 | 22.4 | 8.1 | $9,590 |
| ZTS | Zoetis | 13 | 2.7 | 18.8 | 33.8 | 13.1 | $32,888 |
Dividend Calendar for the Dividend Contenders 2026
Stock Rover* was used to create this table. Sign up to track your dividends and income.
| Ticker | Company | Ex‑Div. Date | Div. Record Date | Div. Payment Date | Dividend Frequency | Next Div. Payment Per Share | Fwd. Div. Per Share |
|---|---|---|---|---|---|---|---|
| A | Agilent Technologies | 10/6/26 | 10/6/26 | 10/28/26 | 4 | $0.25 | $1.02 |
| AAPL | Apple | 8/10/26 | 8/10/26 | 8/13/26 | 4 | $0.27 | $1.08 |
| ABBV | AbbVie | 10/15/26 | 10/15/26 | 11/16/26 | 4 | $1.73 | $6.92 |
| ACN | Accenture | 10/13/26 | 10/13/26 | 11/13/26 | 4 | $1.71 | $6.84 |
| ADC | Agree Realty | 10/30/26 | 10/30/26 | 11/13/26 | 12 | $0.27 | $3.25 |
| ADI | Analog Devices | 9/1/26 | 9/1/26 | 9/15/26 | 4 | $1.10 | $4.40 |
| AEE | Ameren | 12/8/26 | 12/8/26 | 12/31/26 | 4 | $0.75 | $3.00 |
| AEP | American Electric Power | 11/10/26 | 11/10/26 | 12/10/26 | 4 | $0.97 | $3.88 |
| AES | AES | 10/30/26 | 10/30/26 | 11/13/26 | 4 | $0.18 | $0.70 |
| AFG | American Financial Group | 10/15/26 | 10/15/26 | 10/23/26 | 4 | $0.97 | $3.88 |
| AGM | Federal Agricultural | 9/15/26 | 9/15/26 | 9/30/26 | 4 | $1.60 | $6.30 |
| AGO | Assured Guaranty | 8/20/26 | 8/20/26 | 9/3/26 | 4 | $0.38 | $1.52 |
| AIT | Applied Industrial Techs | 8/14/26 | 8/14/26 | 8/31/26 | 4 | $0.51 | $2.04 |
| AIZ | Assurant | 8/31/26 | 8/31/26 | 9/28/26 | 4 | $0.88 | $3.52 |
| AJG | Arthur J. Gallagher | 9/8/26 | 9/8/26 | 9/18/26 | 4 | $0.70 | $2.80 |
| ALG | Alamo Group | 10/15/26 | 10/15/26 | 10/28/26 | 4 | $0.34 | $1.36 |
| ALL | Allstate | 8/31/26 | 8/31/26 | 10/1/26 | 4 | $1.08 | $4.32 |
| ALLE | Allegion | 9/15/26 | 9/15/26 | 9/30/26 | 4 | $0.55 | $2.20 |
| AMGN | Amgen | 8/21/26 | 8/21/26 | 9/11/26 | 4 | $2.52 | $10.08 |
| AMP | Ameriprise Financial | 8/3/26 | 8/3/26 | 8/21/26 | 4 | $1.70 | $6.80 |
| AMSF | AMERISAFE | 9/11/26 | 9/11/26 | 9/25/26 | 4 | $0.41 | $1.64 |
| AMT | American Tower | 9/30/26 | 9/30/26 | 10/20/26 | 4 | $1.79 | $7.16 |
| AON | Aon | 11/2/26 | 11/2/26 | 11/13/26 | 4 | $0.82 | $3.28 |
| APH | Amphenol | 9/22/26 | 9/22/26 | 10/14/26 | 4 | $0.12 | $0.50 |
| APOG | Apogee Enterprises | 10/20/26 | 10/20/26 | 11/4/26 | 4 | $0.27 | $1.08 |
| ASB | Associated Banc | 9/1/26 | 9/1/26 | 9/15/26 | 4 | $0.24 | $0.96 |
| AUB | Atlantic Union Bankshares | 8/7/26 | 8/7/26 | 8/21/26 | 4 | $0.37 | $1.48 |
| AVA | Avista | 8/18/26 | 8/18/26 | 9/14/26 | 4 | $0.49 | $1.97 |
| AVGO | Broadcom | 9/21/26 | 9/21/26 | 9/30/26 | 4 | $0.65 | $2.60 |
| AVNT | Avient | 12/11/26 | 12/11/26 | 1/7/27 | 4 | $0.28 | $1.13 |
| AVT | Avnet | 9/9/26 | 9/9/26 | 9/23/26 | 4 | $0.37 | $1.48 |
| AVY | Avery Dennison | 12/2/26 | 12/2/26 | 12/16/26 | 4 | $1.00 | $4.00 |
| AWK | American Water Works Co | 8/11/26 | 8/11/26 | 9/1/26 | 4 | $0.89 | $3.58 |
| BAC | Bank of America | 12/4/26 | 12/4/26 | 12/24/26 | 4 | $0.32 | $1.28 |
| BAH | Booz Allen Hamilton | 8/14/26 | 8/14/26 | 8/28/26 | 4 | $0.59 | $2.36 |
| BBY | Best Buy Co | 9/17/26 | 9/17/26 | 10/8/26 | 4 | $0.96 | $3.84 |
| BC | Brunswick | 8/20/26 | 8/20/26 | 9/15/26 | 4 | $0.44 | $1.76 |
| BCPC | Balchem | 12/23/25 | 12/23/25 | 1/20/26 | 1 | $0.96 | $0.96 |
| BF.A | Brown-Forman | 9/3/26 | 9/3/26 | 10/1/26 | 4 | $0.23 | $0.92 |
| BFC | Bank First | 12/23/26 | 12/23/26 | 1/6/27 | 4 | $0.65 | $2.60 |
| BHB | Bar Harbor Bankshares | 11/19/26 | 11/19/26 | 12/18/26 | 4 | $0.34 | $1.36 |
| BIP | Brookfield Infr Partners | 8/31/26 | 8/31/26 | 9/29/26 | 4 | $0.46 | $1.82 |
| BLK | BlackRock | 9/8/26 | 9/8/26 | 9/22/26 | 4 | $5.73 | $22.92 |
| BMY | Bristol-Myers Squibb | 10/2/26 | 10/2/26 | 11/2/26 | 4 | $0.63 | $2.52 |
| BNY | Bank of New York Mellon | 10/26/26 | 10/26/26 | 11/9/26 | 4 | $0.63 | $2.22 |
| BOKF | BOK Financial | 8/19/26 | 8/19/26 | 9/2/26 | 4 | $0.63 | $2.52 |
| BR | Broadridge Financial | 9/3/26 | 9/3/26 | 10/5/26 | 4 | $1.09 | $4.36 |
| BWXT | BWX Technologies | 8/18/26 | 8/18/26 | 9/4/26 | 4 | $0.27 | $1.06 |
| CASS | Cass Information Systems | 12/4/26 | 12/4/26 | 12/14/26 | 4 | $0.34 | $1.36 |
| CBOE | Cboe Global Markets | 11/30/26 | 11/30/26 | 12/15/26 | 4 | $0.86 | $3.44 |
| CBT | Cabot | 8/28/26 | 8/28/26 | 9/11/26 | 4 | $0.47 | $1.85 |
| CCBG | Capital City Bank Group | 9/8/26 | 9/8/26 | 9/22/26 | 4 | $0.27 | $1.08 |
| CDW | CDW | 8/25/26 | 8/25/26 | 9/10/26 | 4 | $0.63 | $2.52 |
| CHCO | City Holding | 10/15/26 | 10/15/26 | 10/30/26 | 4 | $1.00 | $4.00 |
| CHCT | Community Healthcare | 8/19/26 | 8/19/26 | 8/31/26 | 4 | $0.33 | $1.76 |
| CHDN | Churchill Downs | 12/5/25 | 12/5/25 | 1/6/26 | 1 | $0.44 | $0.44 |
| CHE | Chemed | 8/17/26 | 8/17/26 | 9/3/26 | 4 | $0.70 | $2.80 |
| CIVB | Civista Bancshares | 11/3/26 | 11/3/26 | 11/17/26 | 4 | $0.18 | $0.72 |
| CMCSA | Comcast | 1/6/27 | 1/6/27 | 1/27/27 | 4 | $0.33 | $1.32 |
| CME | CME Group | 9/9/26 | 9/9/26 | 9/25/26 | 4 | $1.30 | $5.20 |
| CMI | Cummins | 11/20/26 | 11/20/26 | 12/3/26 | 4 | $2.20 | $8.80 |
| CMS | CMS Energy | 11/6/26 | 11/6/26 | 12/1/26 | 4 | $0.57 | $2.28 |
| CNO | CNO Finl Group | 9/10/26 | 9/10/26 | 9/24/26 | 4 | $0.18 | $0.72 |
| CNS | Cohen & Steers | 8/10/26 | 8/10/26 | 8/20/26 | 4 | $0.67 | $2.68 |
| COR | Cencora | 8/14/26 | 8/14/26 | 8/31/26 | 4 | $0.60 | $2.40 |
| COST | Costco Wholesale | 10/30/26 | 10/30/26 | 11/13/26 | 4 | $1.47 | $5.88 |
| CPK | Chesapeake Utilities | 9/14/26 | 9/14/26 | 10/5/26 | 4 | $0.74 | $2.94 |
| CSCO | Cisco Systems | 10/2/26 | 10/2/26 | 10/21/26 | 4 | $0.42 | $1.68 |
| CSX | CSX | 11/30/26 | 11/30/26 | 12/15/26 | 4 | $0.14 | $0.56 |
| CTRE | CareTrust REIT | 9/30/26 | 9/30/26 | 10/15/26 | 4 | $0.39 | $1.56 |
| CUBE | CubeSmart | 10/1/26 | 10/1/26 | 10/15/26 | 4 | $0.53 | $2.12 |
| DDS | Dillard's | 9/30/26 | 9/30/26 | 11/2/26 | 4 | $0.30 | $1.20 |
| DGICA | Donegal Group | 11/2/26 | 11/2/26 | 11/16/26 | 4 | $0.19 | $0.77 |
| DGX | Quest Diagnostics | 10/6/26 | 10/6/26 | 10/21/26 | 4 | $0.86 | $3.44 |
| DHI | D.R. Horton | 8/6/26 | 8/6/26 | 8/13/26 | 4 | $0.45 | $1.80 |
| DHR | Danaher | 9/30/26 | 9/30/26 | 10/30/26 | 4 | $0.40 | $1.60 |
| DKL | Delek Logistics Partners | 8/3/26 | 8/3/26 | 8/10/26 | 4 | $1.13 | $4.51 |
| DKS | Dick's Sporting Goods | 9/11/26 | 9/11/26 | 9/25/26 | 4 | $1.25 | $5.00 |
| DLB | Dolby Laboratories | 8/11/26 | 8/11/26 | 8/19/26 | 4 | $0.36 | $1.44 |
| DOX | Amdocs | 9/30/26 | 9/30/26 | 10/30/26 | 4 | $0.57 | $2.28 |
| DPZ | Domino's Pizza | 12/15/26 | 12/15/26 | 12/30/26 | 4 | $1.99 | $7.96 |
| DTE | DTE Energy | 9/21/26 | 9/21/26 | 10/15/26 | 4 | $1.16 | $4.66 |
| DUK | Duke Energy | 11/13/26 | 11/13/26 | 12/16/26 | 4 | $1.09 | $4.34 |
| EBMT | Eagle Bancorp Montana | 8/14/26 | 8/14/26 | 9/4/26 | 4 | $0.15 | $0.59 |
| EFSC | Enterprise Finl Servs | 12/15/26 | 12/15/26 | 12/31/26 | 4 | $0.36 | $1.34 |
| EIX | Edison International | 10/7/26 | 10/7/26 | 10/31/26 | 4 | $0.88 | $3.51 |
| ELS | Equity Lifestyle Props | 9/25/26 | 9/25/26 | 10/9/26 | 4 | $0.54 | $2.17 |
| ELV | Elevance Health | 12/4/26 | 12/4/26 | 12/18/26 | 4 | $1.72 | $6.88 |
| EMN | Eastman Chemical | 9/15/26 | 9/15/26 | 10/7/26 | 4 | $0.84 | $3.36 |
| ENSG | Ensign Group | 9/30/26 | 9/30/26 | 10/31/26 | 4 | $0.06 | $0.26 |
| EQIX | Equinix | 8/19/26 | 8/19/26 | 9/16/26 | 4 | $5.16 | $20.64 |
| ETN | Eaton Corp | 8/7/26 | 8/7/26 | 8/28/26 | 4 | $1.10 | $4.40 |
| ETR | Entergy | 8/13/26 | 8/13/26 | 9/1/26 | 4 | $0.64 | $2.56 |
| EVR | Evercore | 8/28/26 | 8/28/26 | 9/11/26 | 4 | $0.89 | $3.56 |
| EVRG | Evergy | 8/18/26 | 8/18/26 | 9/18/26 | 4 | $0.69 | $2.78 |
| EXPO | Exponent | 9/4/26 | 9/4/26 | 9/18/26 | 4 | $0.31 | $1.23 |
| FAF | First American Financial | 9/28/26 | 9/28/26 | 10/5/26 | 4 | $0.61 | $2.44 |
| FBIZ | First Business Finl Servs | 8/12/26 | 8/12/26 | 8/26/26 | 4 | $0.34 | $1.36 |
| FCBC | First Community | 8/7/26 | 8/7/26 | 8/21/26 | 4 | $0.33 | $1.26 |
| FDBC | Fidelity D & D Bancorp | 11/13/26 | 11/14/26 | 12/10/26 | 4 | $0.46 | $1.72 |
| FFIN | First Finl Bankshares | 9/14/26 | 9/14/26 | 10/1/26 | 4 | $0.22 | $0.88 |
| FITB | Fifth Third Bancorp | 9/30/26 | 9/30/26 | 10/15/26 | 4 | $0.42 | $1.68 |
| FIX | Comfort Systems USA | 11/12/26 | 11/12/26 | 11/23/26 | 4 | $1.00 | $4.00 |
| FMAO | Farmers & Merchants | 10/9/26 | 10/9/26 | 10/20/26 | 4 | $0.24 | $0.96 |
| FNF | Fidelity National Finl | 9/16/26 | 9/16/26 | 9/30/26 | 4 | $0.52 | $2.08 |
| FNLC | First Bancorp | 10/6/26 | 10/6/26 | 10/16/26 | 4 | $0.38 | $1.52 |
| FNV | Franco-Nevada | 9/10/26 | 9/10/26 | 9/24/26 | 4 | $0.44 | $1.76 |
| FR | First Industrial Realty | 9/30/26 | 9/30/26 | 10/19/26 | 4 | $0.50 | $2.00 |
| FRME | First Merchants | 9/4/26 | 9/4/26 | 9/18/26 | 4 | $0.37 | $1.48 |
| FSBW | FS Bancorp | 11/6/26 | 11/6/26 | 11/20/26 | 4 | $0.29 | $1.16 |
| GABC | German American Bancorp | 8/10/26 | 8/10/26 | 8/20/26 | 4 | $0.31 | $1.22 |
| GATX | GATX | 9/15/26 | 9/15/26 | 9/30/26 | 4 | $0.66 | $2.64 |
| GFF | Griffon | 8/31/26 | 8/31/26 | 9/16/26 | 4 | $0.22 | $0.88 |
| GL | Globe Life | 10/5/26 | 10/5/26 | 10/30/26 | 4 | $0.33 | $1.32 |
| GS | Goldman Sachs Group | 12/2/26 | 12/2/26 | 12/30/26 | 4 | $5.00 | $20.00 |
| GTY | Getty Realty | 12/24/26 | 12/24/26 | 1/7/27 | 4 | $0.50 | $2.00 |
| HBCP | Home Bancorp | 11/2/26 | 11/2/26 | 11/13/26 | 4 | $0.32 | $1.25 |
| HD | Home Depot | 9/3/26 | 9/3/26 | 9/17/26 | 4 | $2.33 | $9.32 |
| HEI | Heico | 7/1/26 | 7/1/26 | 7/15/26 | 2 | $0.13 | $0.25 |
| HFBL | Home Federal Bancorp Inc | 11/2/26 | 11/2/26 | 11/16/26 | 4 | $0.15 | $0.60 |
| HFWA | Heritage Financial | 11/4/26 | 11/4/26 | 11/18/26 | 4 | $0.25 | $1.00 |
| HIG | The Hartford Insurance Gr | 9/1/26 | 9/1/26 | 10/2/26 | 4 | $0.60 | $2.40 |
| HII | Huntington Ingalls Indus | 11/27/26 | 11/27/26 | 12/11/26 | 4 | $1.41 | $5.64 |
| HMN | Horace Mann Educators | 9/16/26 | 9/16/26 | 9/30/26 | 4 | $0.36 | $1.44 |
| HNI | HNI | 8/28/26 | 8/28/26 | 9/11/26 | 4 | $0.35 | $1.40 |
| HOMB | Home BancShares | 11/10/26 | 11/11/26 | 12/2/26 | 4 | $0.23 | $0.86 |
| HPQ | HP | 9/9/26 | 9/9/26 | 10/7/26 | 4 | $0.30 | $1.20 |
| HUBB | Hubbell | 8/31/26 | 8/31/26 | 9/15/26 | 4 | $1.42 | $5.68 |
| HVT | Haverty Furniture Cos | 8/25/26 | 8/25/26 | 9/9/26 | 4 | $0.33 | $1.32 |
| HWBK | Hawthorn Bancshares | 9/15/26 | 9/15/26 | 10/1/26 | 4 | $0.21 | $0.84 |
| HWKN | Hawkins | 8/14/26 | 8/14/26 | 8/28/26 | 4 | $0.20 | $0.80 |
| HY | Hyster Yale | 9/1/26 | 9/1/26 | 9/15/26 | 4 | $0.37 | $1.45 |
| IBCP | Independent Bank | 11/3/26 | 11/3/26 | 11/13/26 | 4 | $0.28 | $1.12 |
| IBOC | International Bancshares | 8/14/26 | 8/14/26 | 8/28/26 | 2 | $0.73 | $1.46 |
| ICE | Intercontinental Exchange | 12/16/26 | 12/16/26 | 12/31/26 | 4 | $0.52 | $2.08 |
| IDA | Idacorp | 11/5/26 | 11/5/26 | 11/30/26 | 4 | $0.90 | $3.60 |
| IEX | IDEX | 10/2/26 | 10/2/26 | 10/16/26 | 4 | $0.73 | $2.92 |
| INDB | Independent Bank | 9/28/26 | 9/28/26 | 10/9/26 | 4 | $0.64 | $2.56 |
| INGR | Ingredion | 10/1/26 | 10/1/26 | 10/20/26 | 4 | $0.83 | $3.32 |
| INTU | Intuit | 10/8/26 | 10/8/26 | 10/16/26 | 4 | $1.38 | $5.52 |
| IOSP | Innospec | 5/19/26 | 5/19/26 | 5/29/26 | 2 | $0.92 | $1.79 |
| ISTR | Investar Holding | 9/30/26 | 9/30/26 | 10/30/26 | 4 | $0.12 | $0.48 |
| ITT | ITT | 9/8/26 | 9/8/26 | 10/5/26 | 4 | $0.39 | $1.54 |
| JBHT | JB Hunt Transport Servs | 11/6/26 | 11/6/26 | 11/20/26 | 4 | $0.45 | $1.80 |
| JJSF | J&J Snack Foods | 9/15/26 | 9/15/26 | 10/6/26 | 4 | $0.80 | $3.20 |
| JPM | JPMorgan Chase | 10/6/26 | 10/6/26 | 10/31/26 | 4 | $1.65 | $6.60 |
| KAI | Kadant | 10/15/26 | 10/15/26 | 11/12/26 | 4 | $0.36 | $1.44 |
| KLAC | KLA | 8/17/26 | 8/17/26 | 9/1/26 | 4 | $0.23 | $0.92 |
| KR | Kroger | 11/16/26 | 11/16/26 | 12/1/26 | 4 | $0.39 | $1.56 |
| KWR | Quaker Houghton | 10/16/26 | 10/16/26 | 10/30/26 | 4 | $0.53 | $2.12 |
| LAD | Lithia Motors | 11/6/26 | 11/6/26 | 11/20/26 | 4 | $0.75 | $3.00 |
| LAND | Gladstone Land | 11/19/26 | 11/19/26 | 11/30/26 | 12 | $0.05 | $0.56 |
| LFUS | Littelfuse | 8/20/26 | 8/20/26 | 9/3/26 | 4 | $0.80 | $3.20 |
| LHX | L3Harris Technologies | 12/4/26 | 12/4/26 | 12/18/26 | 4 | $1.25 | $5.00 |
| LII | Lennox International | 9/30/26 | 9/30/26 | 10/15/26 | 4 | $1.36 | $5.44 |
| LKFN | Lakeland Financial | 7/24/26 | 7/25/26 | 8/5/26 | 4 | $0.52 | $2.08 |
| LLY | Eli Lilly | 8/14/26 | 8/14/26 | 9/10/26 | 4 | $1.73 | $6.92 |
| LMAT | LeMaitre Vascular | 8/20/26 | 8/20/26 | 9/3/26 | 4 | $0.25 | $1.00 |
| LMT | Lockheed Martin | 12/1/26 | 12/1/26 | 12/31/26 | 4 | $3.60 | $14.40 |
| LNN | Lindsay | 11/16/26 | 11/16/26 | 11/30/26 | 4 | $0.38 | $1.52 |
| LNT | Alliant Energy | 10/30/26 | 10/30/26 | 11/16/26 | 4 | $0.54 | $2.14 |
| LOGI | Logitech International | 9/21/26 | 9/22/26 | 9/23/26 | 1 | $1.65 | $1.66 |
| LRCX | Lam Research | 9/23/26 | 9/23/26 | 10/14/26 | 4 | $0.33 | $1.32 |
| LSTR | Landstar System | 8/18/26 | 8/18/26 | 9/9/26 | 4 | $0.44 | $1.76 |
| LYB | LyondellBasell Industries | 8/24/26 | 8/24/26 | 8/31/26 | 4 | $0.69 | $2.76 |
| MA | Mastercard | 10/9/26 | 10/9/26 | 11/9/26 | 4 | $0.87 | $3.48 |
| MAA | Mid-America Apartment | 10/15/26 | 10/15/26 | 10/30/26 | 4 | $1.53 | $6.12 |
| MAIN | Main Street Capital | 11/6/26 | 11/6/26 | 11/13/26 | 12 | $0.26 | $3.18 |
| MAS | Masco | 8/24/26 | 8/24/26 | 8/28/26 | 4 | $0.32 | $1.28 |
| MATX | Matson | 11/5/26 | 11/5/26 | 12/3/26 | 4 | $0.38 | $1.52 |
| MBWM | Mercantile Bank | 12/4/26 | 12/4/26 | 12/16/26 | 4 | $0.40 | $1.60 |
| MCHP | Microchip Technology | 8/24/26 | 8/24/26 | 9/9/26 | 4 | $0.46 | $1.82 |
| MCK | McKesson | 12/1/26 | 12/1/26 | 1/4/27 | 4 | $0.94 | $3.76 |
| MCO | Moodys | 8/14/26 | 8/14/26 | 9/4/26 | 4 | $1.03 | $4.12 |
| MDLZ | Mondelez International | 9/30/26 | 9/30/26 | 10/14/26 | 4 | $0.52 | $2.08 |
| MET | MetLife | 11/3/26 | 11/3/26 | 12/8/26 | 4 | $0.59 | $2.37 |
| MGA | Magna International | 8/14/26 | 8/14/26 | 8/28/26 | 4 | $0.50 | $1.98 |
| MKTX | MarketAxess Holdings | 8/19/26 | 8/19/26 | 9/2/26 | 4 | $0.78 | $3.12 |
| MORN | Morningstar | 10/2/26 | 10/2/26 | 10/30/26 | 4 | $0.50 | $2.00 |
| MPLX | MPLX | 8/7/26 | 8/7/26 | 8/14/26 | 4 | $1.08 | $4.31 |
| MRK | Merck & Co | 9/15/26 | 9/15/26 | 10/7/26 | 4 | $0.85 | $3.40 |
| MRSH | Marsh | 10/1/26 | 10/1/26 | 11/13/26 | 4 | $0.99 | $3.96 |
| MS | Morgan Stanley | 7/31/26 | 7/31/26 | 8/14/26 | 4 | $1.15 | $4.60 |
| MSCI | MSCI | 11/13/26 | 11/13/26 | 11/27/26 | 4 | $2.05 | $8.20 |
| MSEX | Middlesex Water | 8/17/26 | 8/17/26 | 9/1/26 | 4 | $0.36 | $1.44 |
| MSFT | Microsoft | 11/19/26 | 11/19/26 | 12/10/26 | 4 | $0.98 | $3.92 |
| MSI | Motorola Solutions | 9/16/26 | 9/16/26 | 10/15/26 | 4 | $1.21 | $4.84 |
| MTRN | Materion | 8/20/26 | 8/20/26 | 9/4/26 | 4 | $0.14 | $0.58 |
| MWA | Mueller Water Products | 11/9/26 | 11/9/26 | 11/19/26 | 4 | $0.08 | $0.32 |
| NBTB | NBT Bancorp | 9/1/26 | 9/1/26 | 9/15/26 | 4 | $0.40 | $1.60 |
| NDAQ | Nasdaq | 12/4/26 | 12/4/26 | 12/18/26 | 4 | $0.31 | $1.16 |
| NHC | National Healthcare | 9/30/26 | 9/30/26 | 10/30/26 | 4 | $0.67 | $2.68 |
| NKE | Nike | 9/1/26 | 9/1/26 | 10/1/26 | 4 | $0.41 | $1.64 |
| NNI | Nelnet | 9/1/26 | 9/1/26 | 9/15/26 | 4 | $0.33 | $1.32 |
| NOC | Northrop Grumman | 8/31/26 | 8/31/26 | 9/16/26 | 4 | $2.47 | $9.88 |
| NRIM | Northrim BanCorp | 9/10/26 | 9/10/26 | 9/18/26 | 4 | $0.17 | $0.65 |
| NSP | Insperity | 9/2/26 | 9/2/26 | 9/17/26 | 4 | $0.60 | $2.40 |
| NWE | NorthWestern Energy Group | 8/17/26 | 8/17/26 | 9/1/26 | 4 | $0.67 | $2.68 |
| NXST | Nexstar Media Gr | 8/14/26 | 8/14/26 | 8/28/26 | 4 | $1.86 | $7.44 |
| OC | Owens-Corning | 10/19/26 | 10/19/26 | 11/5/26 | 4 | $0.79 | $3.16 |
| ODC | Oil-Dri Corp of America | 11/6/26 | 11/6/26 | 11/20/26 | 4 | $0.22 | $0.90 |
| OGE | OGE Energy | 10/5/26 | 10/5/26 | 10/30/26 | 4 | $0.43 | $1.72 |
| OGS | ONE Gas | 8/17/26 | 8/17/26 | 8/31/26 | 4 | $0.68 | $2.72 |
| ORCL | Oracle | 10/9/26 | 10/9/26 | 10/23/26 | 4 | $0.50 | $2.00 |
| OSK | Oshkosh | 8/13/26 | 8/13/26 | 8/27/26 | 4 | $0.57 | $2.28 |
| OTEX | Open Text | 9/4/26 | 9/4/26 | 9/18/26 | 4 | $0.28 | $1.12 |
| OTTR | Otter Tail | 8/14/26 | 8/14/26 | 9/10/26 | 4 | $0.58 | $2.26 |
| OVLY | Oak Valley | 8/3/26 | 8/3/26 | 8/14/26 | 2 | $0.38 | $0.75 |
| PAYX | Paychex | 10/26/26 | 10/26/26 | 11/25/26 | 4 | $1.19 | $4.76 |
| PB | Prosperity Bancshares | 12/15/26 | 12/15/26 | 1/4/27 | 4 | $0.64 | $2.56 |
| PEBO | Peoples Bancorp | 11/2/26 | 11/2/26 | 11/16/26 | 4 | $0.42 | $1.68 |
| PEG | Public Service Enterprise | 9/9/26 | 9/9/26 | 9/30/26 | 4 | $0.67 | $2.68 |
| PFE | Pfizer | 11/6/26 | 11/6/26 | 12/7/26 | 4 | $0.43 | $1.72 |
| PFG | Principal Financial Group | 9/3/26 | 9/3/26 | 9/25/26 | 4 | $0.84 | $3.36 |
| PLD | Prologis | 9/16/26 | 9/16/26 | 9/30/26 | 4 | $1.07 | $4.28 |
| PM | Philip Morris Intl | 10/2/26 | 10/2/26 | 10/26/26 | 4 | $1.60 | $6.40 |
| PNC | PNC Financial Services Gr | 10/14/26 | 10/14/26 | 11/5/26 | 4 | $2.00 | $8.00 |
| PNW | Pinnacle West Capital | 11/2/26 | 11/2/26 | 12/1/26 | 4 | $0.93 | $3.70 |
| POOL | Pool | 8/13/26 | 8/13/26 | 8/27/26 | 4 | $1.30 | $5.20 |
| POR | Portland General Electric | 9/25/26 | 9/25/26 | 10/15/26 | 4 | $0.55 | $2.20 |
| POWI | Power Integrations | 8/31/26 | 8/31/26 | 9/30/26 | 4 | $0.22 | $0.86 |
| PRGO | Perrigo | 8/28/26 | 8/28/26 | 9/15/26 | 4 | $0.29 | $1.16 |
| PRI | Primerica | 8/21/26 | 8/21/26 | 9/14/26 | 4 | $1.20 | $4.80 |
| PRU | Prudential Financial | 8/25/26 | 8/25/26 | 9/10/26 | 4 | $1.40 | $5.60 |
| PSX | Phillips 66 | 11/17/26 | 11/17/26 | 12/1/26 | 4 | $1.33 | $5.32 |
| QCOM | Qualcomm | 12/3/26 | 12/3/26 | 12/17/26 | 4 | $0.92 | $3.68 |
| QSR | Restaurant Brands Intl | 9/18/26 | 9/18/26 | 10/2/26 | 4 | $0.65 | $2.60 |
| R | Ryder System | 11/23/26 | 11/23/26 | 12/18/26 | 4 | $1.01 | $4.04 |
| RBA | RB Global | 8/25/26 | 8/25/26 | 9/17/26 | 4 | $0.33 | $1.32 |
| REXR | Rexford Industrial Realty | 12/11/26 | 12/12/26 | 1/15/27 | 4 | $0.44 | $1.74 |
| RF | Regions Financial | 12/1/26 | 12/1/26 | 1/4/27 | 4 | $0.30 | $1.20 |
| RGA | Reinsurance Group | 8/18/26 | 8/18/26 | 9/1/26 | 4 | $0.98 | $3.92 |
| RGCO | RGC Resources | 10/16/26 | 10/16/26 | 11/2/26 | 4 | $0.22 | $0.87 |
| RGLD | Royal Gold | 10/2/26 | 10/2/26 | 10/16/26 | 4 | $0.47 | $1.90 |
| RHI | Robert Half | 8/25/26 | 8/25/26 | 9/15/26 | 4 | $0.59 | $2.36 |
| RJF | Raymond James Finl | 10/1/26 | 10/1/26 | 10/15/26 | 4 | $0.54 | $2.16 |
| RMD | ResMed | 8/20/26 | 8/20/26 | 9/24/26 | 4 | $0.66 | $2.64 |
| ROK | Rockwell Automation | 8/17/26 | 8/17/26 | 9/10/26 | 4 | $1.38 | $5.52 |
| RS | Reliance | 8/14/26 | 8/14/26 | 8/28/26 | 4 | $1.25 | $5.00 |
| RSG | Republic Services | 10/2/26 | 10/2/26 | 10/15/26 | 4 | $0.67 | $2.68 |
| SBFG | SB Financial Group | 8/14/26 | 8/14/26 | 8/28/26 | 4 | $0.16 | $0.64 |
| SBUX | Starbucks | 11/13/26 | 11/13/26 | 11/27/26 | 4 | $0.63 | $2.52 |
| SCI | Service Corp Intl | 9/15/26 | 9/15/26 | 9/30/26 | 4 | $0.36 | $1.44 |
| SFBS | Servisfirst Bancshares | 10/1/26 | 10/1/26 | 10/9/26 | 4 | $0.19 | $0.76 |
| SFNC | Simmons First Ntl | 9/15/26 | 9/15/26 | 10/1/26 | 4 | $0.22 | $0.86 |
| SGU | Star Group | 10/26/26 | 10/26/26 | 11/4/26 | 4 | $0.20 | $0.79 |
| SHOE | Shoe Station Group | 10/6/26 | 10/6/26 | 10/20/26 | 4 | $0.17 | $0.68 |
| SIGI | Selective Insurance Gr | 11/16/26 | 11/16/26 | 12/1/26 | 4 | $0.48 | $1.92 |
| SMBC | Southern Missouri Bancorp | 11/13/26 | 11/13/26 | 11/30/26 | 4 | $0.27 | $1.08 |
| SNA | Snap-on | 8/19/26 | 8/19/26 | 9/10/26 | 4 | $2.44 | $9.76 |
Promotions of the Dividend Contenders to Dividend Champions in 2025
In 2025, Cass Information Systems (CASS), Somerset Trust Holdings (SOME), and TC Energy (TRP) were added to the list of Dividend Champions.
Additions and Deletions to the Dividend Contenders
Numerous additions are made to the Dividend Contenders list each year. Due to the large number of companies involved, we are not tracking specific companies. Occasionally, companies fall off the list because they cut or suspended their dividends. However, because of macroeconomic conditions the number has dropped to 311 this year from 354 at the end of last year.
Other Dividend Stock Lists
I have also written about other US stock lists, including
- List of Dividend Kings
- List of Dividend Champions
- List of Dividend Aristocrats
- List of Dividend Challengers
- Dogs of the Dow in 2026
For Canadian stocks, we have an article on
For UK stocks, we have an article on
Other dividend stock lists
FDetails About the Dividend Contenders 2026
What Do We Like About the Dividend Contenders 2026?
The Dividend Contenders 2026 list serves as a screen for further investigating a stock for a dividend growth portfolio. They are companies with stable businesses that have competitive advantages. Moreover, they have returned cash to shareholders consistently through dividends and, in many cases, share buybacks. In addition, many of these companies are not yet mature and are still on decent growth trajectories, resulting in good dividend growth and stock price appreciation.
The Dividend Contenders 2026 List is not as exclusive as the Dividend Kings 2026, Dividend Champions 2026, or Dividend Aristocrats 2026 lists.
The Dividend Contenders 2026 list changes annually. Only a few companies graduate to the Dividend Champions list each year. However, a decent number of companies attain the 10-year mark, adding to the list from the Dividend Challengers list.
Affiliate
Stock Rover is an award winning investment research platform.
- The site has 8,500+ stocks, 4,000 ETFs, and 40,000 mutual funds.
- Access to 650+ metrics, financial data, market news, stock and fund ratings, fair value, margin of safety, etc.
- Includes brokerage integration, portfolio tracking, rebalancing, watchlists, alerts, future income forecasts, etc.
- Plus export to spreadsheets, dividend calendar, 10+ years of data history, etc.
- Best Buy and Hold Screener by Investopedia
- Editor’s Choice by American Association of Individual Investors (AAII).
Click here to try Stock Rover for free (14-day free trial).
Dividend Contenders Sector Breakdown
Companies from the Financial Sector have the most significant representation on the Dividend Contenders 2026 list with 105 companies. Industrials follow this sector with 56 companies, Utilities with 30 companies, Technology with 30 companies, and Consumer Cyclical with 21 companies. The top three sectors have stayed the same in the past few years even though the aggregate numbers have dropped.
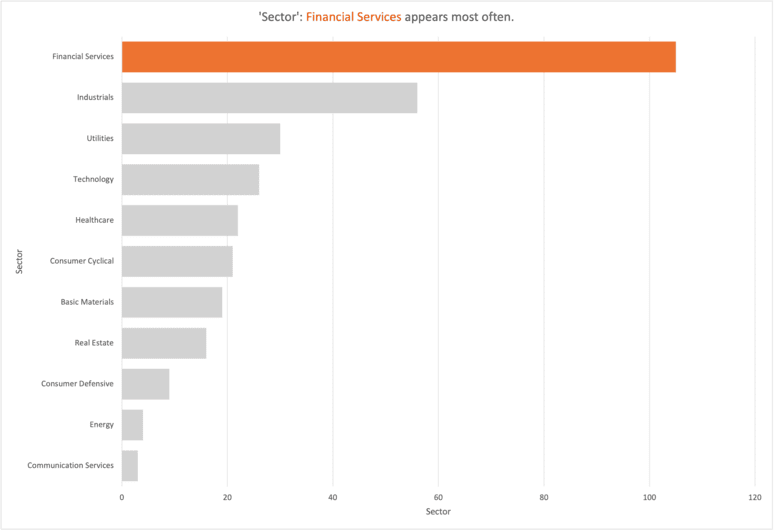
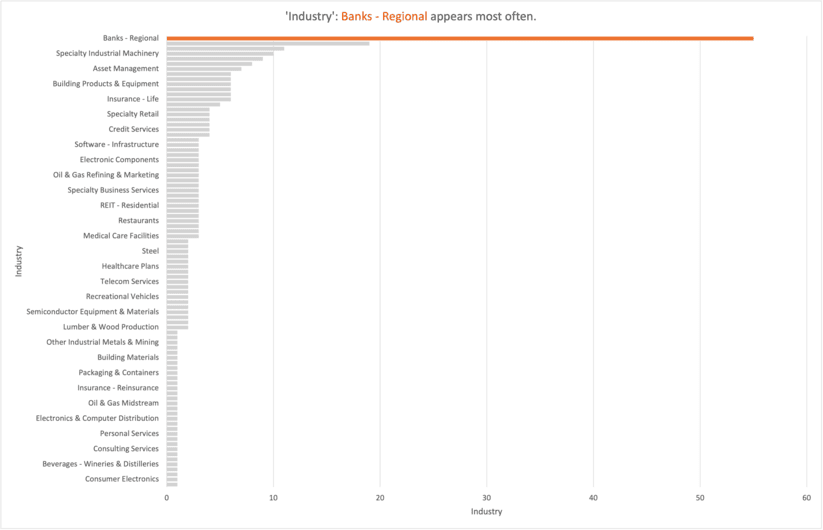
Financials tend to have stable and generally rising earnings over time, except for recessions. Many financial companies cut, froze, or suspended dividends during the Great Recession. However, many also restarted dividend growth as soon as the recovery began. Thus, they are now at ten years or more of consecutive dividend increases, allowing them to enter the Dividend Contenders list. This fact is especially true of regional banks, the number one industry on the list.
Industrial companies tend to have more volatile earnings and cash flows, but many have low payout ratios, allowing them to grow dividends during recessions and economic downturns. The specialty industrial machinery category has a high number on the list.
On the other hand, Utilities tend to have stable and regular cash flow and earnings over long periods. They do not grow quickly but slowly and steadily. Utilities provide a necessary service and product. Both regulated electric and diversified utilities have significant representation on the list.
Market Size of the Dividend Contenders 2026
Large-cap companies do not dominate the list, which includes quite a few mid-cap ($2 billion – $10 billion) and small-cap ($300 million – $2 billion) companies.
The largest of the Dividend Contenders in 2026 by market capitalization is Apple (AAPL), the consumer electronics and software giant. The company has increased the dividend for 14 years in a row. Number two on the list is Microsoft (MSFT), the software and hardware behemoth that has raised its dividend for 24 straight years. Both companies will likely become Dividend Aristocrats and Dividend Champions.
A few companies are on the Dividend Contenders 2026 list with market capitalizations of less than $100M, mainly if we include the over-the-counter (OTC) market. Investors should be wary when investing in companies with small market capitalization due to the associated risks.
Frequently Asked Questions About the Dividend Contenders
A Dividend Contender is a publicly traded company that has successfully increased its annual dividend payout for 10 to 24 consecutive years. They sit directly between Dividend Challengers (5–9 years) and Dividend Champions / Aristocrats (25+ years).
Dividend Contenders have 10 to 24 years of consecutive dividend growth and do not require inclusion in the S&P 500 index. Dividend Aristocrats require at least 25 consecutive years of dividend increases, strict market cap/liquidity thresholds, and mandatory membership in the S&P 500.
Dividend Contenders often represent companies in their prime growth phase—offering higher dividend growth rates and potential total return upside compared to older, mature Dividend Champions.
Here are my recommendations:
Affiliates
- Simply Investing Report & Analysis Platform or the Course can teach you how to invest in stocks. Try it free for 14 days.
- Free Dividend Kings Spreadsheet from Sure Dividend, complete with Buy/Hold/Sell recommendations, dividend histories, and much more. It is an excellent resource for DIY dividend growth investors and retirees.
- Stock Rover is the leading investment research platform with all the fundamental metrics, screens, and analysis tools you need. Try it free for 14 days.
Receive a free e-book, “Become a Better Investor: 5 Fundamental Metrics to Know!” Join thousands of other readers !
*This post contains affiliate links meaning that I earn a commission for any purchases that you make at the Affiliates website through these links. This will not incur additional costs for you. Please read my disclosure for more information.
Prakash Kolli is the founder of the Dividend Power site. He is a self-taught investor, analyst, and writer on dividend growth stocks and financial independence. His writings can be found on Seeking Alpha, InvestorPlace, Business Insider, Nasdaq, TalkMarkets, ValueWalk, The Money Show, Forbes, Yahoo Finance, and leading financial sites. In addition, he is part of the Portfolio Insight and Sure Dividend teams. He was recently in the top 1.0% and 100 (73 out of over 13,450) financial bloggers, as tracked by TipRanks (an independent analyst tracking site) for his articles on Seeking Alpha.